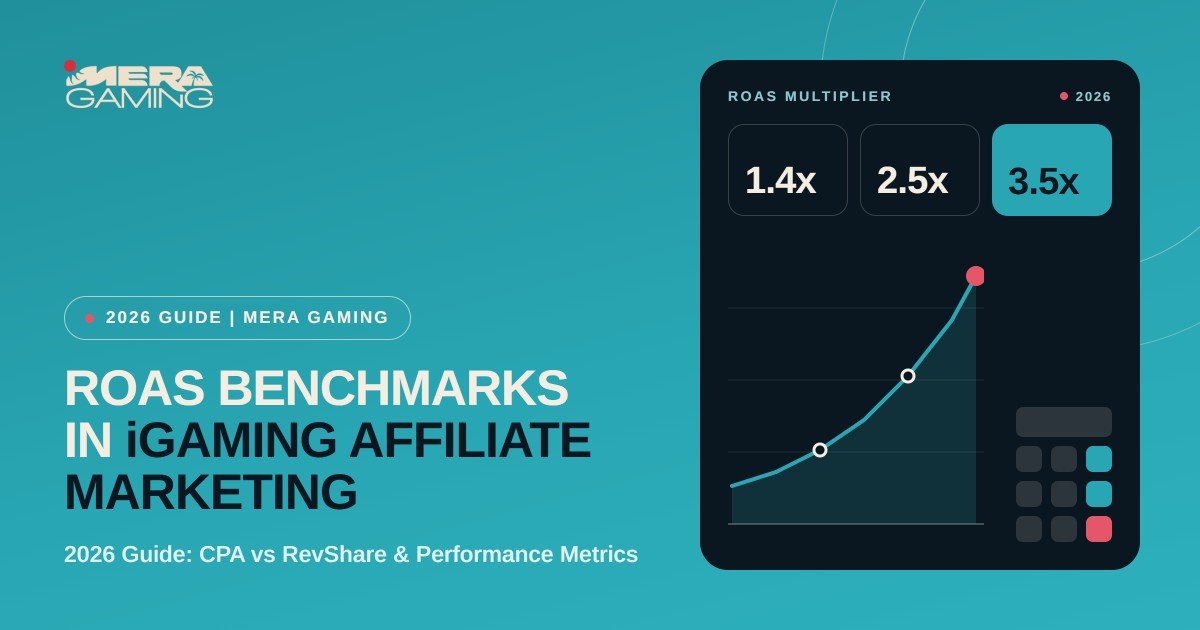
In 2026, iGaming affiliate ROAS benchmarks vary by role. For media buyers on 30-day CPA deals, target metrics range between 1.2x and 1.6x. Meanwhile, online casino and sportsbook operators target a 1.8x to 2.5x ROAS, measured over a 12-month player lifetime value (LTV).
This is why evaluating campaign performance in this industry requires looking far beyond basic conversion rates or click-through statistics. Return on Ad Spend (ROAS) remains the ultimate compass for analyzing financial health and campaign scalability. Understanding how this metric behaves across different commission structures, gaming verticals, and non-gaming industries is essential. It enables media buyers and operators to build sustainable, high-margin partnerships.
What Is ROAS? A Universal Foundation for Digital Marketers
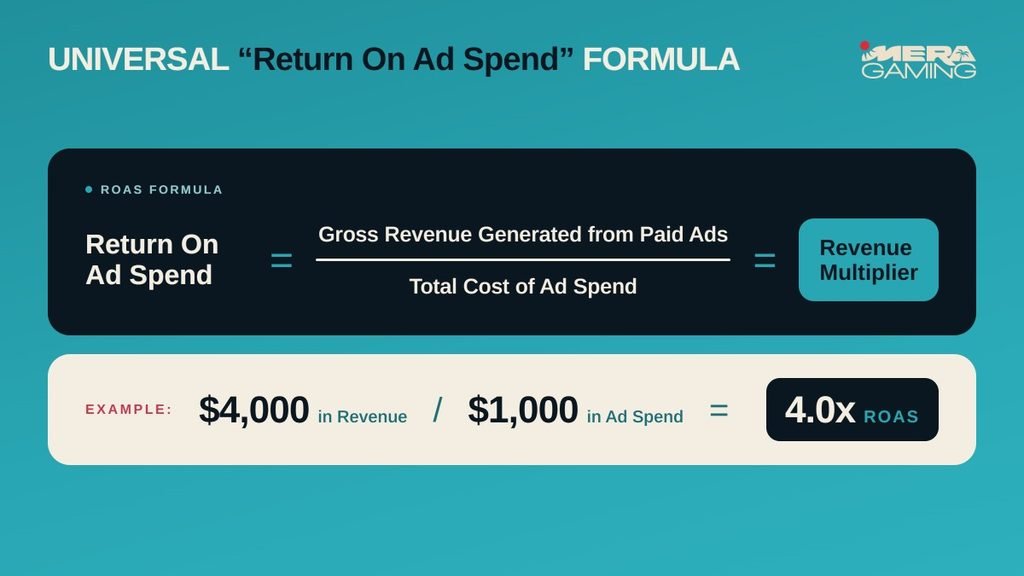
At its core, Return on Ad Spend (ROAS) is a fundamental digital marketing metric that quantifies the gross revenue generated for every single dollar, euro, or local currency unit invested in paid advertising. It serves as an efficiency compass across Google Ads, Facebook campaigns, native ad networks, programmatic buys, and influencer partnerships.
To calculate a standard ROAS benchmark in iGaming, divide the gross revenue directly generated by an advertising campaign by that campaign’s total financial outlay. As a multiplier, 1.0x means the campaign broke even on ad spend, generating exactly as much gross revenue as it cost to run. A multiplier of 3.0x indicates that for every dollar spent, the campaign returned three dollars in gross revenue.
How ROAS Varies Across Other Global Industries
A common misconception among new marketers is that a uniform “good” ROAS exists across all business sectors. In reality, target ROAS benchmarks vary dramatically based on profit margins, cost of goods sold (COGS), sales cycles, and customer retention dynamics.
In traditional e-commerce and retail, a profitable business typically requires a target ROAS between 3.0x and 5.0x.
This high benchmark is driven by heavy overheads, including product sourcing, manufacturing, warehousing, and shipping. Consequently, a 1.0x or even 2.0x ROAS actually leads to severe net financial losses.
Conversely, in B2B SaaS, the initial 30-day ROAS is intentionally low or negative, typically between 0.4x and 0.8x. Because SaaS companies rely on subscription models, they willingly accept upfront customer acquisition losses. They recover these ad costs over a 6- to 12-month payback window through recurring monthly billing.
In Financial Services and Insurance, high Customer Acquisition Costs (CAC) demand a target ROAS between 2.5x and 4.0x. These targets depend heavily on credit approval rates and long-term policy renewals.
In contrast, Mobile Casual Gaming developers accept a Day-7 ROAS as low as 0.2x to 0.35x. They rely on aggressive in-app monetization and ad impressions to push campaign ROAS to 1.0x to 1.5x by Day-90 or Day-180.
The Dual-Perspective ROAS benchmarks in iGaming
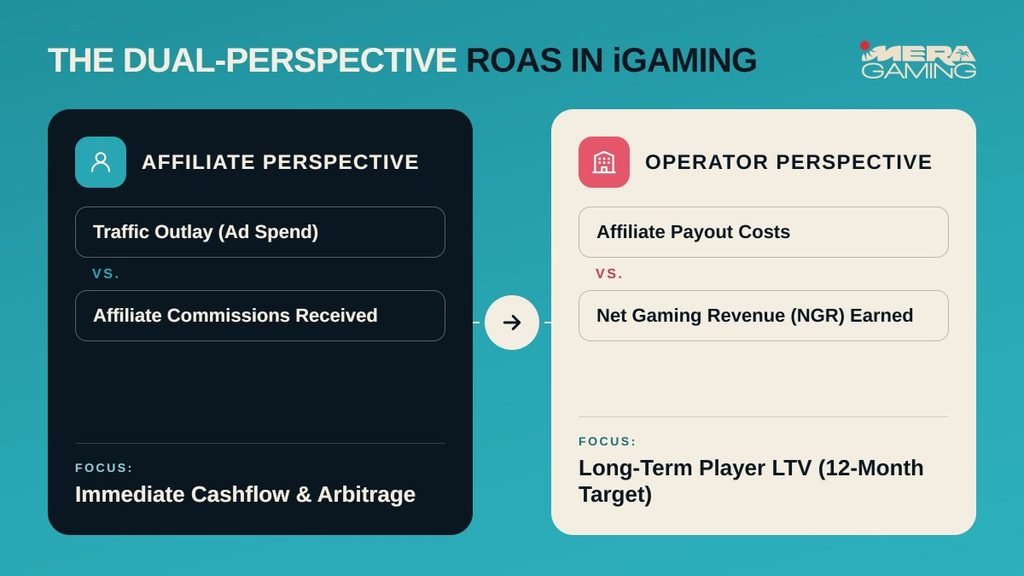
Applying ROAS benchmarks in iGaming to affiliate marketing creates a unique operational dynamic. Unlike standard e-commerce, where a single seller tracks direct product sales, the affiliate ecosystem involves two separate entities. Both the Affiliate (Media Buyer) and the Operator (Casino/Sportsbook Brand) evaluate the same ad spend, but from opposite sides of the transaction.
The Affiliate Perspective (Media Buyers & Webmasters)
For affiliates buying paid search, native, or social traffic, ROAS measures immediate cash-flow efficiency and arbitrage profitability. Media buyers calculate this by dividing total commissions received (from flat CPAs, Revenue Share, or hybrids) by their total ad spend on clicks and impressions.
The main challenge for affiliates is managing cash-flow lag. Platforms like Meta and Google charge ad spend immediately. In contrast, affiliate networks and operators usually pay commissions weekly, bi-weekly, or monthly. To maintain daily liquidity and continuously scale budgets, affiliates need an immediate ROAS above 1.0x.
The Operator Perspective (iGaming Brands)
For operators, affiliates act as an external performance marketing engine. Operators evaluate ROAS by comparing player Net Gaming Revenue (NGR) against the total commissions paid to the affiliate. NGR represents gross player bets minus winnings, bonuses, and gaming taxes.
For operators, the primary strategic focus is Player Lifetime Value (LTV). On high-CPA deals, an operator’s initial 30-day ROAS often looks unprofitable at 0.4x to 0.6x. However, strong internal CRM, loyalty programs, and retention teams can engage those players over time, boosting that same cohort to a 2.0x or 3.0x ROAS over a 12-month period.
2026 iGaming ROAS Benchmarks by Vertical
Performance benchmarks in iGaming vary considerably depending on the specific gaming product being promoted. Differences in player demographic behavior, deposit friction, average bet sizing, and house edge directly shape the financial returns for both parties.
| Vertical | Avg. Affiliate ROAS (30-Day CPA) | Avg. Affiliate ROAS (12-Month RevShare) | Target Operator ROAS (Year 1 LTV) | Key Performance Characteristics |
| Online Casino | 1.2x – 1.6x | 2.0x – 3.5x | 1.8x – 2.5x | Highest player LTV, excellent retention, but requires higher baseline CPA payouts. |
| Sportsbook | 1.1x – 1.4x | 1.5x – 2.2x | 1.4x – 1.9x | Driven by major sports event cycles; lower margins, higher seasonal traffic spikes. |
| Crash / Arcade Games | 1.3x – 1.8x | 1.8x – 2.4x | 1.6x – 2.0x | Fast conversion funnels; highly effective with social media, influencer, and Telegram traffic. |
| Online Poker | 1.0x – 1.25x | 1.6x – 2.1x | 1.5x – 1.8x | Lower immediate conversions; generates stable long-term yield from dedicated rake players. |
Online casinos deliver the highest long-term yield for both operators and affiliates, driven by strong house margins and predictable player LTVs.
Sportsbooks generate massive user volume during major events like the World Cup or Super Bowl. However, off-season churn lowers retention rates and shrinks affiliate ROAS margins.
Meanwhile, arcade and crash games drive rapid acquisition and high short-term conversion, allowing media buyers to hit immediate 1.5x ROAS multipliers.
How Commission Models Shape ROAS Trajectories
The commercial structure agreed upon between an affiliate and an operator fundamentally dictates how profitability evolves over time. Understanding the mathematical trajectory of CPA, Revenue Share, and Hybrid structures is crucial for designing long-term campaign strategies.
ROAS Growth Curve Over 12 Months: CPA vs. RevShare vs. Hybrid
Cost Per Acquisition (CPA) Deals
Under a pure CPA deal, the operator pays the affiliate a fixed monetary reward for every new First Time Depositor (FTD) who meets specific qualifying criteria, such as a minimum baseline deposit.
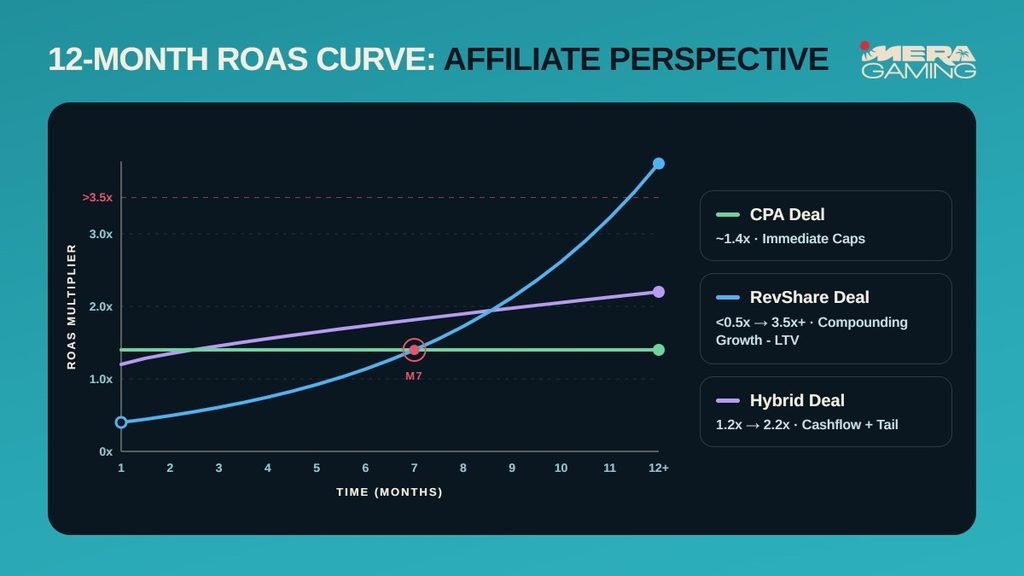
For affiliates, CPA deals offer immediate cash flow. Spending $1,000 on ads to generate 10 First Time Deposits (FTDs) at $140 each yields $1,400 in commissions (an immediate 1.4x ROAS). The trade-off: affiliate revenue for those players is permanently capped.
For operators, CPA deals carry higher upfront risk. They must pay the affiliate immediately and rely on internal retention to make player cohorts profitable over future quarters.
Revenue Share (RevShare) Deals
Revenue Share arrangements invert this financial timeline. Instead of receiving a flat upfront fee, affiliates earn an agreed percentage (typically 25% to 45%) of the Net Gaming Revenue generated by their referred players. They continue earning this payout as long as those players remain active on the platform.
In the first month, an affiliate’s RevShare ROAS often lands below 0.5x as upfront ad spend outweighs early player losses. However, RevShare creates a compounding portfolio. As new player cohorts stack up month after month, cumulative revenue grows exponentially, often pushing effective ROAS above 2.5x to 3.5x by month 6 or 12.
For operators, RevShare is the safest commercial model. Commissions scale directly with net profit, guaranteeing operational profitability from day one.
Hybrid Deals (The Balanced Middle Ground)
Hybrid deals combine a scaled-down upfront CPA payout with a modest ongoing Revenue Share percentage. For example, an affiliate might negotiate an $80 CPA combined with a 20% RevShare, rather than taking a full $160 CPA.
This structure solves the primary operational pain points of both parties.
- The affiliate gets enough upfront cash flow to cover daily ad spend and maintain an immediate 1.0x to 1.1x 30-day ROAS, while still building a long-term RevShare tail.
- For the operator, the upfront financial burden is halved. This allows them to scale acquisition volume while keeping long-term incentives aligned with the publisher.
Regional Variations: Tier 1 vs. Emerging Markets
Geographic targeting heavily influences traffic pricing, conversion mechanics, and achievable ROAS targets. Media buyers must adapt their bid strategies and ROI expectations depending on the economic dynamics of the target market.
In Tier 1 GEOs (such as the UK, Sweden, Germany, and heavily regulated US states) advertiser competition is fierce. High auction demand drives up CPC and CPM rates on search and social platforms.
As a result, media buyers must accept tighter initial margins, targeting a 30-day affiliate ROAS of 1.05x to 1.25x.
Succeeding in Tier 1 markets requires optimized landing pages, strict compliance knowledge, and Hybrid or RevShare deals to capture long-term player LTV.
In Emerging GEOs across Latin America (such as Colombia and Peru), Africa, and Southeast Asia, traffic acquisition costs are substantially lower. Lower CPM rates enable media buyers to hit higher short-term CPA ROAS multipliers, frequently reaching 1.4x to 2.0x.
However, average revenue per user (ARPU) is significantly lower than in European markets. To turn these high user volumes into long-term profit, operators must carefully manage deposit thresholds and optimize payment funnel efficiency.
Operational Factors That Directly Impact ROAS
Achieving competitive ROAS benchmarks requires seamless execution across the entire affiliate funnel. Several operational friction points can quickly degrade campaign profitability if left unmonitored:
- Payment Gateway Friction and Localized Options: If an operator fails to offer popular local payment methods (like PIX in Brazil or mobile wallets in Southeast Asia), cashier conversion rates plunge. This drop wastes the affiliate’s ad spend and depresses overall ROAS.
- Verification and Holding Periods: Extended validation delays by operators choke affiliate cash flow. When commission approvals take weeks, media buyers cannot reinvest capital, halting campaign scaling and stalling profitable growth.
- Ad Fraud and Invalid Traffic: Bot traffic, incentivized registrations, and click spamming artificially inflate early campaign metrics without generating legitimate player activity. This non-performing traffic destroys operator ROAS and inevitably triggers account suspensions and withheld commission payouts for publishers.
- Unrealistic Baseline Requirements: When operators set excessively high minimum deposit thresholds for CPA qualification, landing page conversion rates plunge, making it nearly impossible for media buyers to maintain positive ROAS multipliers on paid traffic channels.
How Affiliates and Operators Can Optimize Their ROAS
Boosting campaign ROAS takes teamwork across two key areas. Media buyers must optimize ad execution, while operators must streamline their conversion funnel.
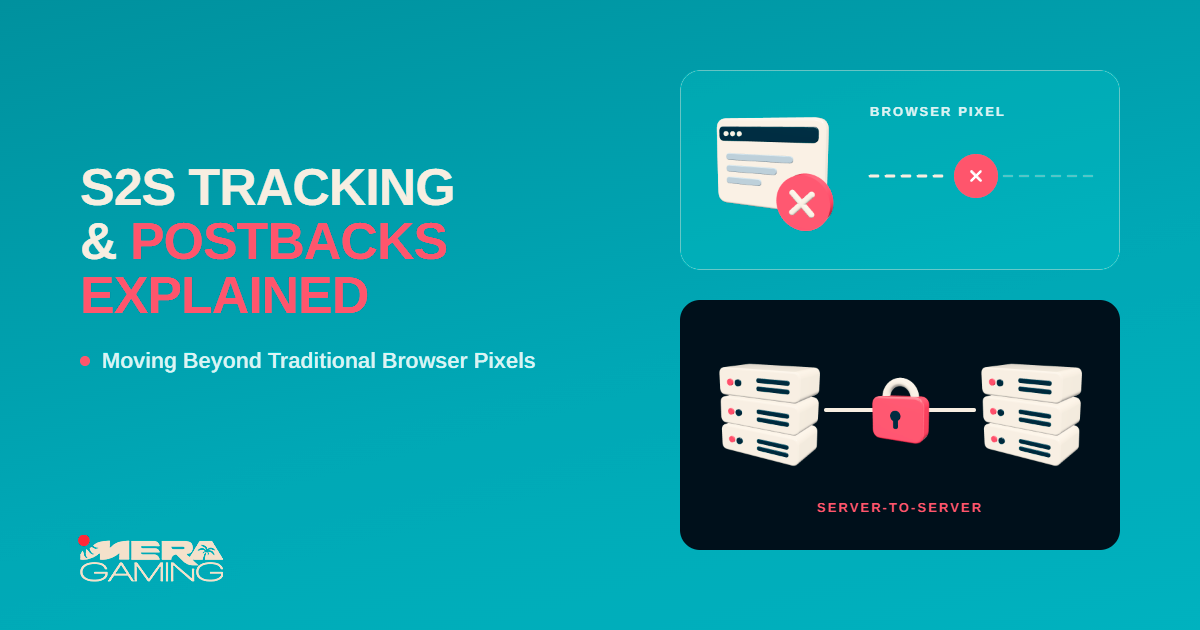
Affiliates should focus on pre-qualification. Interactive pre-landers, quiz funnels, and age checks filter out low-intent clicks before users reach the registration page, boosting FTD conversions and CPA returns. Additionally, using Server-to-Server (S2S) postback tracking sends real-time conversion data back to ad platform algorithms. This helps optimize campaign delivery toward high-intent depositors.
On the other side of the equation, operators must focus on maximizing player LTV and conversion efficiency. Registration funnels should be simple and friction-free. Automated email, SMS, and push notifications must trigger immediately after sign-up to engage new users. Finally, offering transparent, real-time postback reporting builds trust with media buyers (encouraging top publishers to send their best traffic to the brand).
Strategic ROAS Optimization with MERA GAMING
Navigating the financial complexities of iGaming affiliate marketing requires strong analytical foundations, reliable infrastructure, and commercial transparency. MERA GAMING serves as a trusted bridge between high-volume media buyers and world-class iGaming operators.
For affiliates and media buyers, MERA GAMING provides direct access to high-converting, pre-vetted CPA, RevShare, and Hybrid offers across both established Tier 1 and rapidly expanding emerging markets. Backed by flexible payment terms, fast validations, and dedicated affiliate management, we ensure your ad spend scales efficiently with predictable cash flow.
For operators, MERA GAMING delivers verified, compliant, and scalable traffic channels engineered to hit your long-term player LTV targets while protecting your brand’s acquisition margins.
- 👉 For Affiliates: Apply for a MERA GAMING Publisher Account
- 👉 For Operators: Contact us to Discuss Traffic Partnerships